Gaining Insights into Server Cache
Overview
The $info endpoint offers comprehensive insights into the server's cache usage, active user sessions, and internal server metrics. This endpoint is instrumental for developers and administrators to monitor and manage the application's performance and data accessibility effectively.
Properties Returned
General Properties
The $info endpoint returns structured information as outlined in the following table:
| Property | Type | Description |
|---|---|---|
cacheSize | Number | Total allocated cache size in bytes. |
usedCache | Number | Amount of cache currently used in bytes. |
entitySetCount | Number | Number of entity selections currently stored. |
entitySet | Array | Information on active entity selections stored within the server's cache. |
ProgressInfo | Array | Operational progress indicators that may impact server performance. |
sessionInfo | Array | Data on active user sessions, including session duration and expiration. |
memMetrics | Array | Detailed memory usage statistics related to client and server processes. |
privileges | Object | An object with a "privileges" property (collection of objects). Each object of the collection has a "privilege" property with a privilege name of the user session as value. |
entitySet Details
The entitySet provides detailed information about each entity set stored in the cache:
| Property | Type | Description |
|---|---|---|
id | String | Unique identifier for the entity set. |
dataClass | String | Name of the dataclass associated with the entity set. |
selectionSize | Number | Number of entities within the set. |
sorted | Boolean | Indicates if the set is sorted. |
refreshed | Date | Timestamp when the entity set was last accessed or refreshed. |
expires | Date | Expiry timestamp after which the entity set may be cleared from cache. |
Additionally, for creating or releasing an entity set from the cache:
-
Creating an Entity Set: Use
$method=entitysetto initiate a new entity selection within the cache, specifying the desired parameters for entity retrieval. -
Releasing an Entity Set: To remove an entity set from the cache, employ
$method=release, ensuring the specific set is targeted for clearance.
The server automatically generates certain entity selections for internal optimizations. Therefore, the entity sets you manually create are part of a broader collection managed by the system.
ProgressInfo Details
The ProgressInfo provides information about ongoing operations that may affect server performance:
| Property | Type | Description |
|---|---|---|
UserInfo | String | Identifier for the type of progress (e.g., index or flush). |
SessionCount | Number | Number of sessions affected by this operation. |
Title | String | Title or name of the operation, if applicable. |
CanInterrupt | Boolean | Indicates whether the operation can be interrupted. |
sessionInfo Details
The sessionInfo details each active user session to help monitor access and system usage:
| Property | Type | Description |
|---|---|---|
sessionID | String | Unique identifier for the user session. |
lifeTime | Number | Duration the session is set to remain active, in seconds. |
expiration | Date | Timestamp when the session is scheduled to expire. |
memMetrics Details
The memMetrics provides a detailed breakdown of memory usage across different server processes, particularly focusing on client interactions and REST API handlers:
| Key | Type | Description |
|---|---|---|
clients | Object | An object that currently has no data (empty). Future implementations may populate this with client-specific memory usage data. |
processes | Object | Memory usage broken down by server processes such as the Client Manager and REST Handler. |
methods | Object | Memory usage associated with internal methods. |
total | Object | Cumulative memory metrics across all processes and methods. |
Example Context: Client Manager and REST Handler
In the processes section, memory usage is detailed for key server components like the Client Manager and the REST Handler:
-
Client Manager: Manages client connections and data transactions.
methods: Details internal methods and their memory usage.total: Aggregates the memory usage for the entire process.
-
REST Handler: Manages REST API requests and responses.
methods: Specific to handling REST requests, including caching and entity management.total: Summarizes memory usage directly attributed to REST operations.
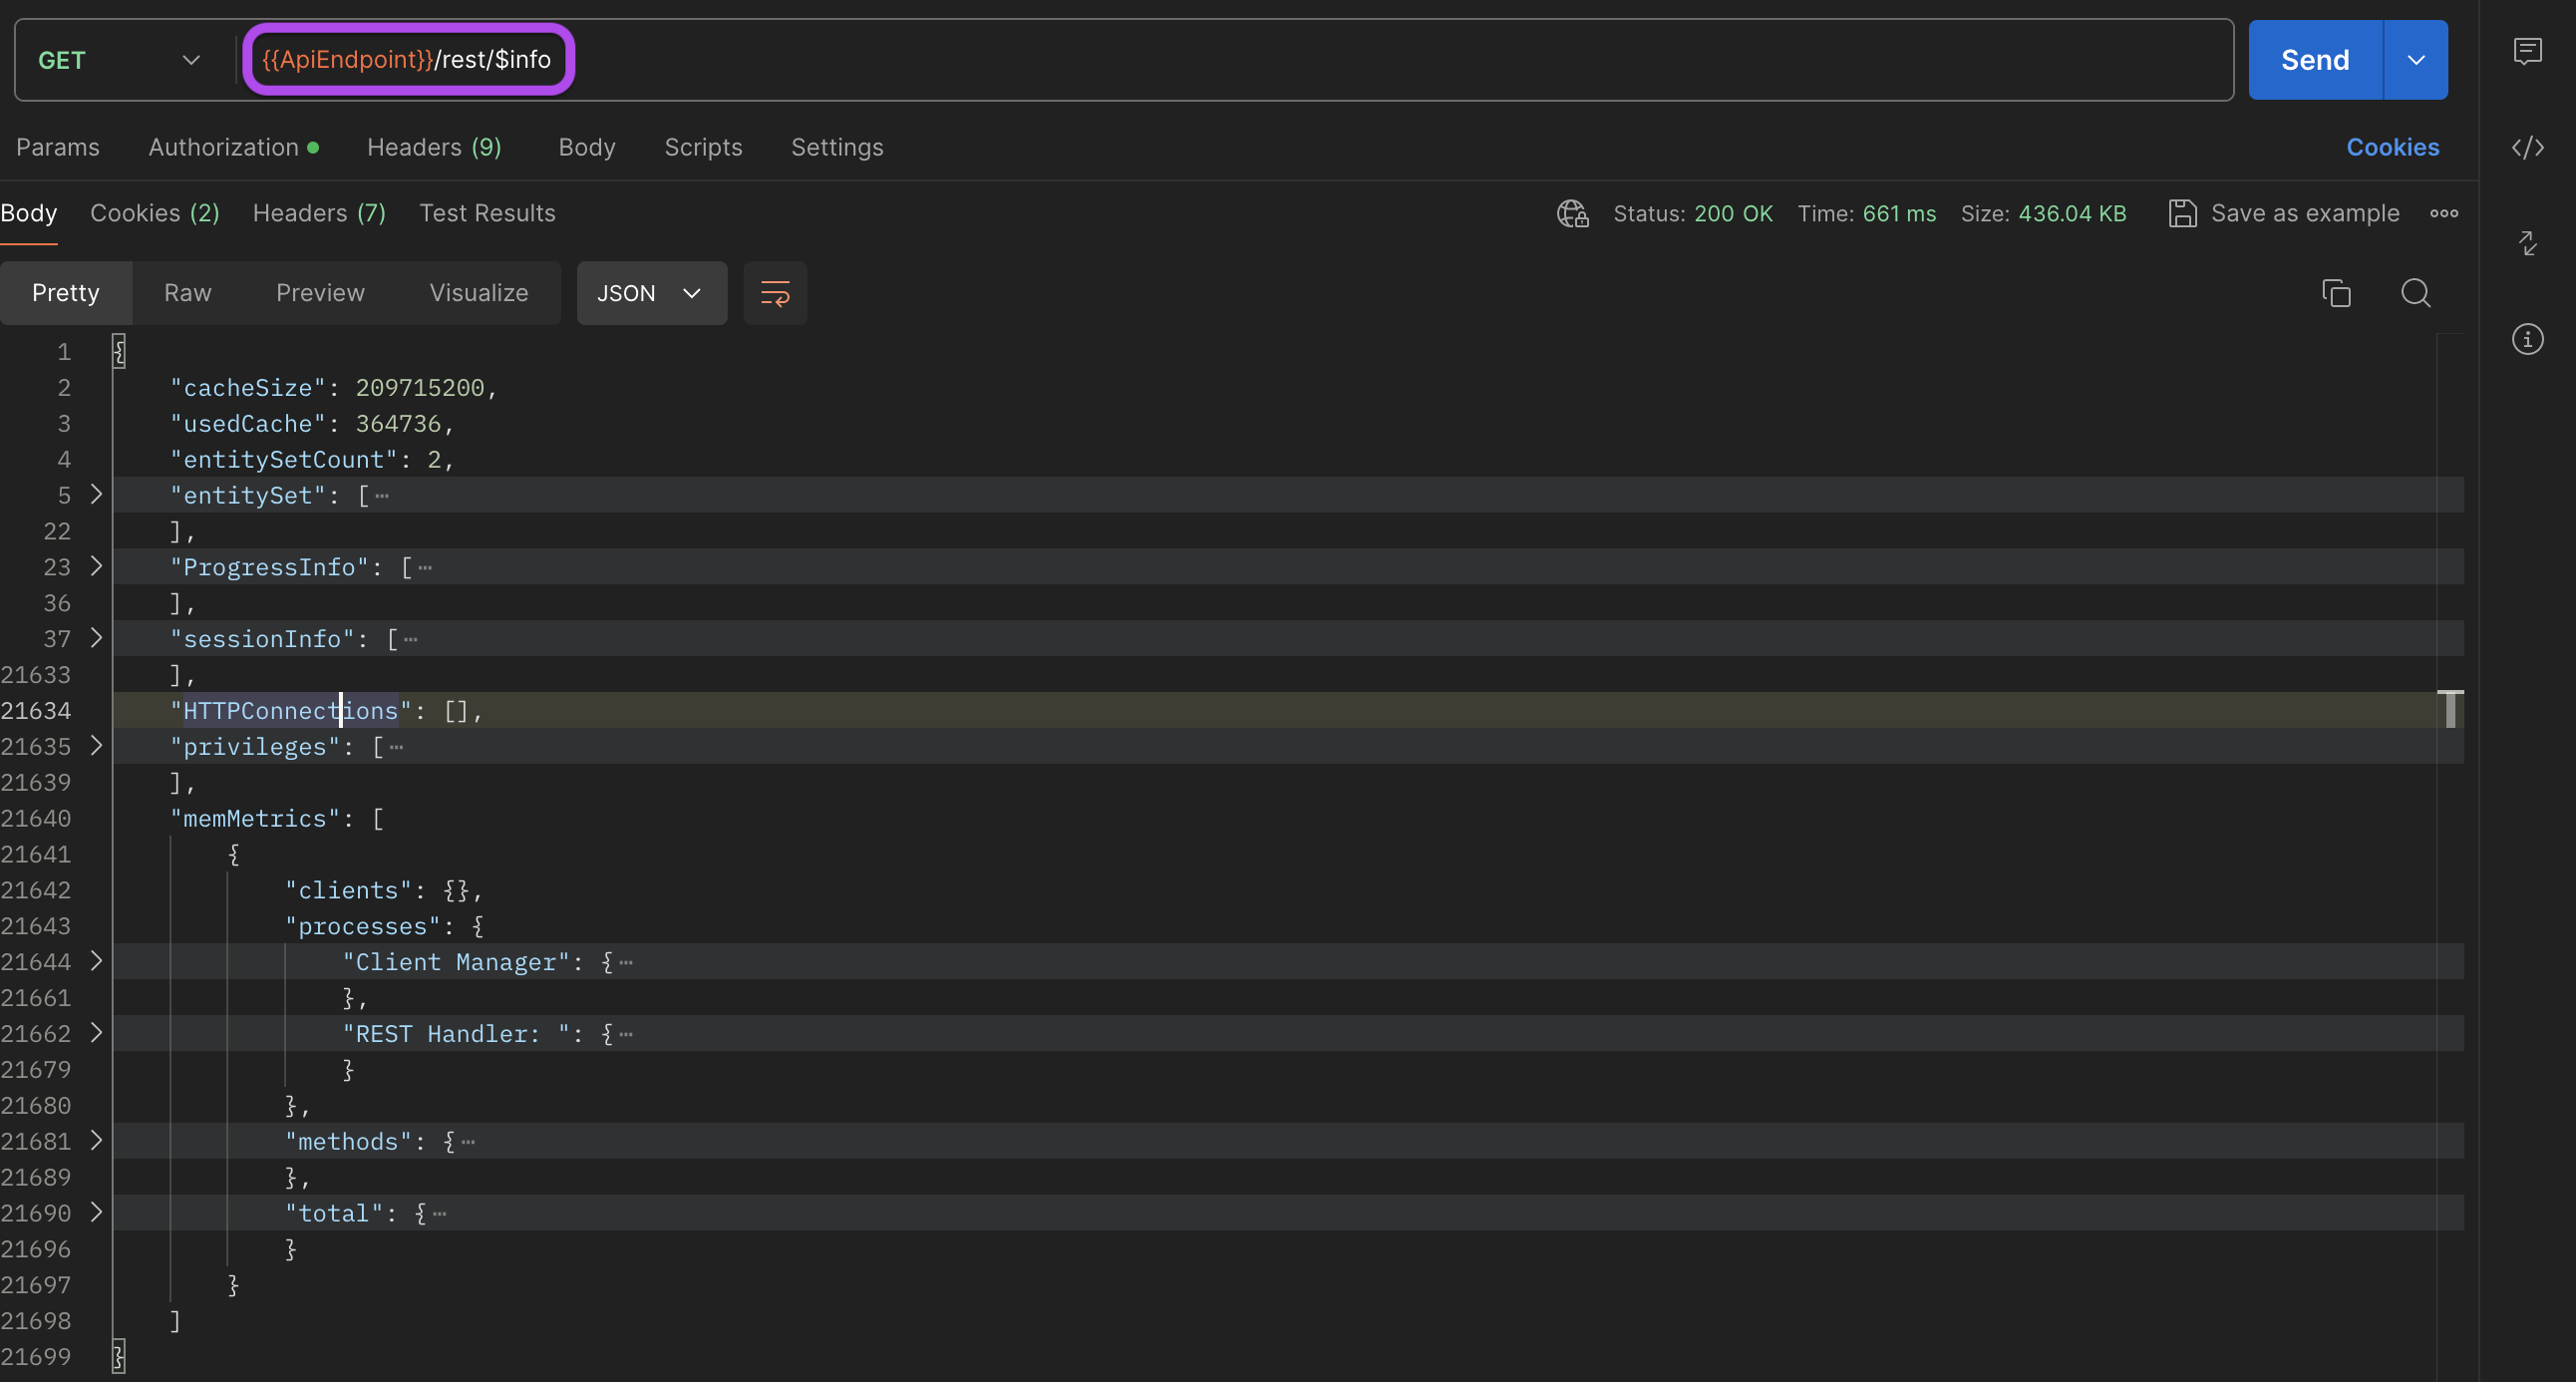
Sample Usage Example in Postman
How to Use:
- Method: GET
- URL:
{{ApiEndpoint}}/rest/$info

The response structure for the $info endpoint looks something like this in practice:
{
    "cacheSize": 209715200,
    "usedCache": 328760,
    "entitySetCount": 1,
    "entitySet": [
        {
            "id": "9BCEC36AD6ED4104BE817C47C360AB0D",
            "dataClass": "Users",
            "selectionSize": 10,
            "sorted": false,
            "refreshed": "2024-05-12T00:21:38.575Z",
            "expires": "2024-05-12T02:21:38.575Z"
        }
    ],
    "ProgressInfo": [
        {
            "UserInfo": "flushProgressIndicator",
            "SessionCount": 0,
            "Title": "",
            "CanInterrupt": false
        },
        {
            "UserInfo": "indexProgressIndicator",
            "SessionCount": 0,
            "Title": "",
            "CanInterrupt": true
        }
    ],
    "sessionInfo": [
        {
            "sessionID": "00130D6E779E4681873A8B46B694C2DD",
            "lifeTime": 60,
            "expiration": "2024-05-12T01:03:34.942Z"
        },
        {
            "sessionID": "0024480DF07143F995C445C20470E901",
            "lifeTime": 60,
            "expiration": "2024-05-12T00:53:48.042Z"
        },
    ],
    "HTTPConnections": [],
    "privileges": [
        {
            "privilege": "guest"
        }
    ],
    "memMetrics": [
        {
            "clients": {},
            "processes": {
                "Client Manager": {
                    "methods": {
                        "[internal]": {
                            "entities": 0,
                            "entitySelections": 0,
                            "records": 0,
                            "selections": 0,
                            "bittables": 8
                        }
                    },
                    "total": {
                        "entities": 0,
                        "entitySelections": 0,
                        "records": 0,
                        "selections": 0,
                        "bittables": 8
                    }
                },
                "REST Handler: ": {
                    "methods": {
                        "[internal]": {
                            "entities": 0,
                            "entitySelections": 1,
                            "records": 0,
                            "selections": 1,
                            "bittables": 1
                        }
                    },
                    "total": {
                        "entities": 0,
                        "entitySelections": 1,
                        "records": 0,
                        "selections": 1,
                        "bittables": 1
                    }
                }
            },
            "methods": {
                "[internal]": {
                    "entities": 0,
                    "entitySelections": 0,
                    "records": 0,
                    "selections": 0,
                    "bittables": 8
                }
            },
            "total": {
                "entities": 0,
                "entitySelections": 1,
                "records": 0,
                "selections": 1,
                "bittables": 9
            }
        }
    ]
}