Debugging
Errors are a common occurrence when writing code. It is unusual to write a substantial amount of code without encountering any errors. Fortunately, dealing with and resolving errors is a routine part of the development process.
In the Qodly development environment, you have access to a range of debugging tools to help you tackle different types of errors effectively.
Starting a debug session
To execute your code line-by-line and evaluate expressions, you must initiate a debug session on the server and attach it to your browser. Follow these steps:
-
Click the Debug button located in Qodly Studio toolbar.

-
If the debug session starts successfully, a green bullet will appear on the button label.

-
Once you begin executing code within the debug session, the bullet will turn orange.

You can only have one active debug session per instance. If another instance of the application has an active debug session (e.g., started from another browser), the debug button will display a warning message.
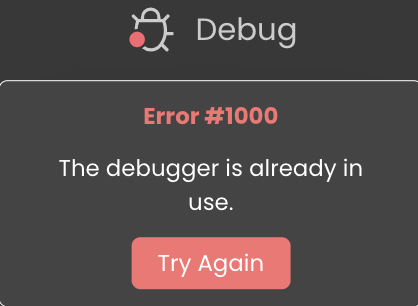
In such cases, you must wait until the other debug session is closed before starting a new one.
Verify that the method or function with the breakpoint is saved and not in draft state for the breakpoint to take effect during debugging.
Stopping a debug session
If you wish to stop a debug session, follow these steps:
-
Click the Debug button in Qodly Studio toolbar while a debug session is active.
-
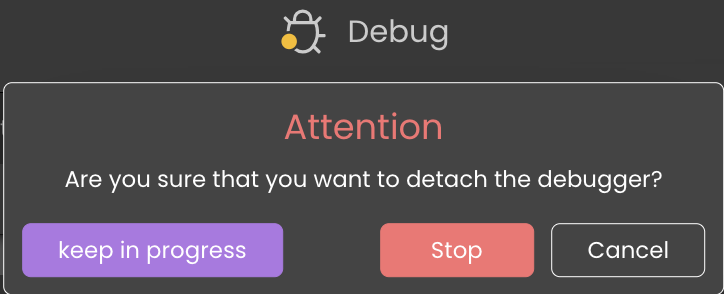
A warning dialog box will prompt you to confirm whether you want to detach the debugger, effectively closing the debug session attached to your browser. You will have several options:
- Keep in progress: Qodly will continue evaluating the code until the end of the current method or function, and then the debugger will be detached.
- Stop: The debugger will be immediately detached.
- Cancel: The debugger will not be detached.
Breakpoints
Breakpoints allow you to pause code execution at specific points in your code. You can set breakpoints on any line of code where you want the execution to halt. Here's how to create a breakpoint:
-
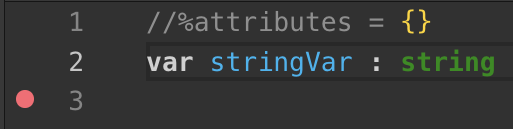
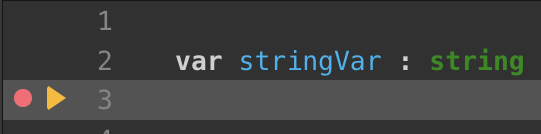
Click in the left margin of the code editor. This action will display a red bullet.
-
When you launch the code, a yellow arrow will appear in the left margin to indicate where the execution paused and mark the next line to be executed.
-
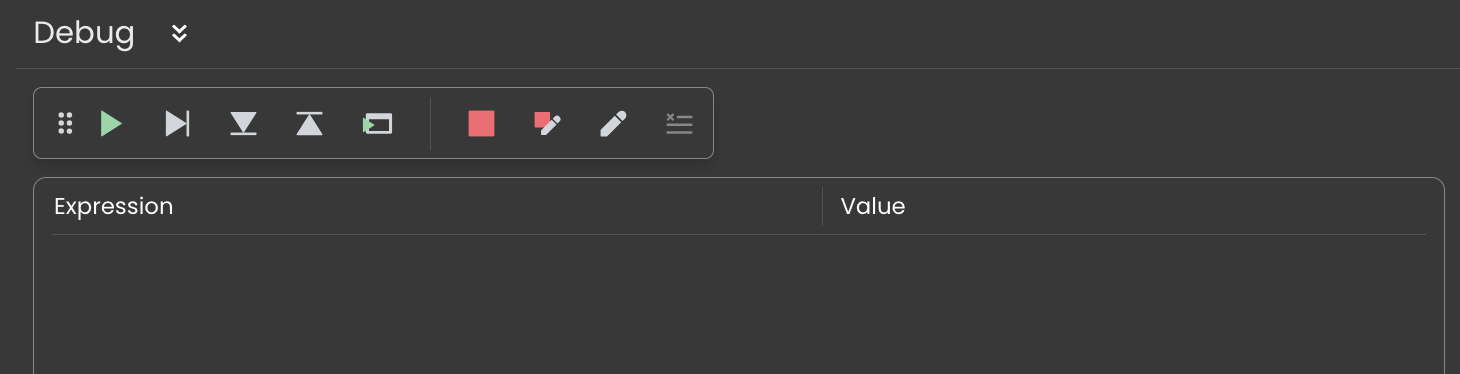
At this point, you can use the debugger panel at the bottom of the window to evaluate and debug your code.
Should a function appear unexpectedly, even without any breakpoints in your code while the debugger is active, it implies the existence of an error within that specific code section.
Breakpoint Status
Breakpoints can have different statuses depending on the context, which are represented by their appearance and tip:
| Appearance | Status | Context |
|---|---|---|
 | Breakpoint | The breakpoint is validated in the debug session and will pause code execution as expected. |
 | Draft breakpoint | The method or function where the breakpoint is set has not been correctly saved. Please ensure you save your changes first for the breakpoint to be validated and take effect. |
 | Unverified breakpoint | The breakpoint is saved, but no debug session is currently active. It will not pause code execution until a debug session is started. |
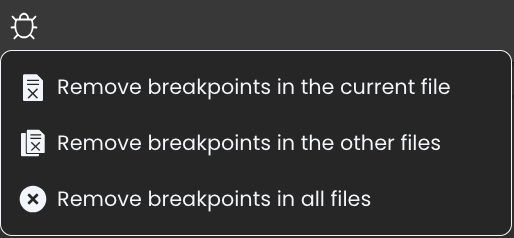
Breakpoints Management
Managing breakpoints is crucial for a streamlined debugging process. By using a specific button  within the code editor, you can perform various actions to organize your breakpoints:
- Remove Breakpoints in the Current File: Clears all breakpoints from your active file.
- Remove Breakpoints in Other Files: Removes all breakpoints from non-active files.
- Remove Breakpoints in All Files: Eliminates all breakpoints across the entire project.